Japanese Corporate Price Index Slide
Full prompt
Goal: Create a clean Japanese economic infographic slide summarizing the corporate goods price index速報 for {argument name="report month" default="2026年6月"}.

Canvas: 16:9 horizontal presentation slide, white background with very pale blue accents, ample margins, polished corporate report design. Use navy as the main text color and bright medium blue for numerical percentages. Add a small gray page number “01” at the bottom right.

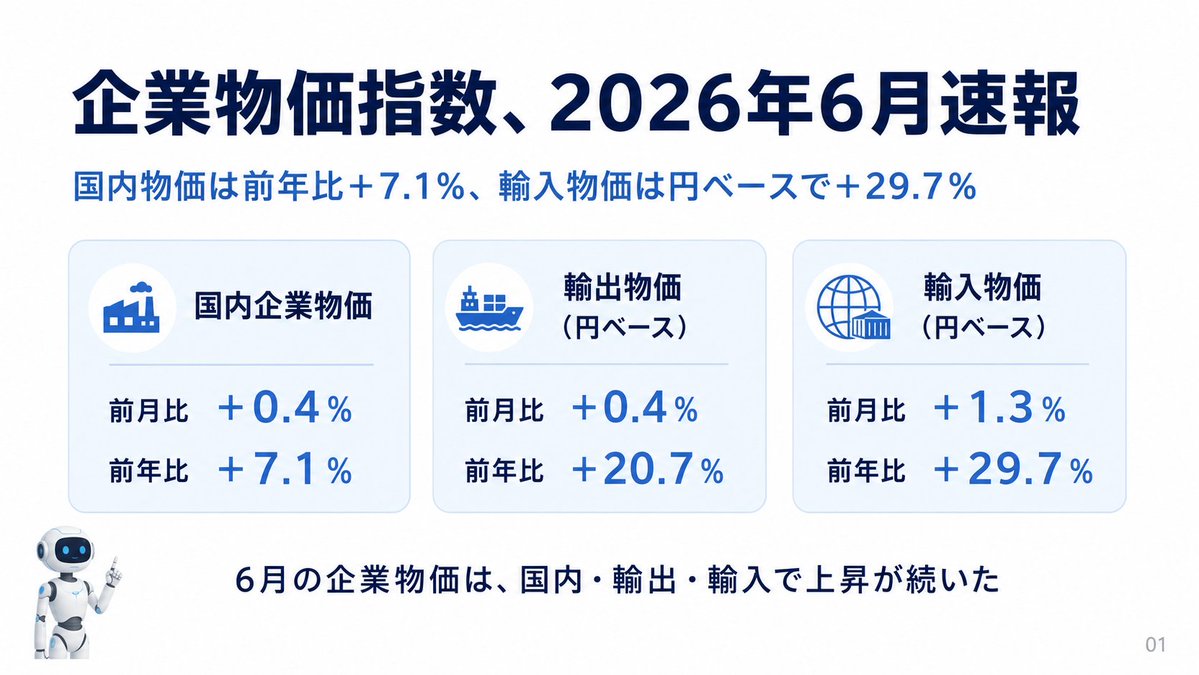
Layout: Large headline at the top left reading “企業物価指数、{argument name="report month" default="2026年6月"}速報”. Directly below it, a blue subtitle reading “国内物価は前年比+7.1%、輸入物価は円ベースで+29.7%”. Center the main content as exactly 3 rounded rectangular statistic cards in one horizontal row, each with a light blue border, subtle shadow, faint blue gradient fill, a circular icon area at top left, a bold Japanese category title, a thin divider line, and two metric rows. At the bottom, place a small friendly white-and-blue robot mascot on the lower left, pointing upward, and a centered conclusion sentence.

Statistic cards: Use exactly 3 cards. Card 1: factory icon, title “国内企業物価”, metric rows “前月比 +0.4%” and “前年比 +7.1%”. Card 2: cargo ship icon, title “輸出物価(円ベース)”, metric rows “前月比 +0.4%” and “前年比 +20.7%”. Card 3: globe and container/warehouse icon, title “輸入物価(円ベース)”, metric rows “前月比 +1.3%” and “前年比 +29.7%”. Make the percentages large and bright blue, aligned to the right of each row label.

Bottom text: Centered near the bottom in bold navy Japanese: “6月の企業物価は、国内・輸出・輸入で上昇が続いた”.

Visual style: Modern Japanese business presentation, crisp vector icons, rounded corners, soft shadows, balanced whitespace, consistent alignment. No charts or extra decorations beyond the 3 cards, the robot mascot, and page number. Keep all Japanese text legible and exactly as specified.
Use this prompt in the VdoBloom image editor.
Opens the image editor with this prompt — add your own photo to generate.