GeoPT Physics Simulation Overview Slide
Full prompt
Goal: Create a clean 16:9 academic overview slide explaining {argument name="paper concept" default="GeoPT: Scaling Physics Simulation via Lifted Geometric Pre-Training"}, styled like a polished conference-deck infographic.

Canvas: Widescreen white slide, navy-blue typography and accents, minimal shadows, high-resolution scientific illustration style. Use a thin blue footer line with small circular endpoints.

Header: Large bold dark-navy title at the top: {argument name="headline text" default="GeoPT: Scaling Physics Simulation via Lifted Geometric Pre-Training"}. Directly underneath, smaller blue subtitle: {argument name="subtitle text" default="An intuitive overview of Wu et al. (2026)"}.

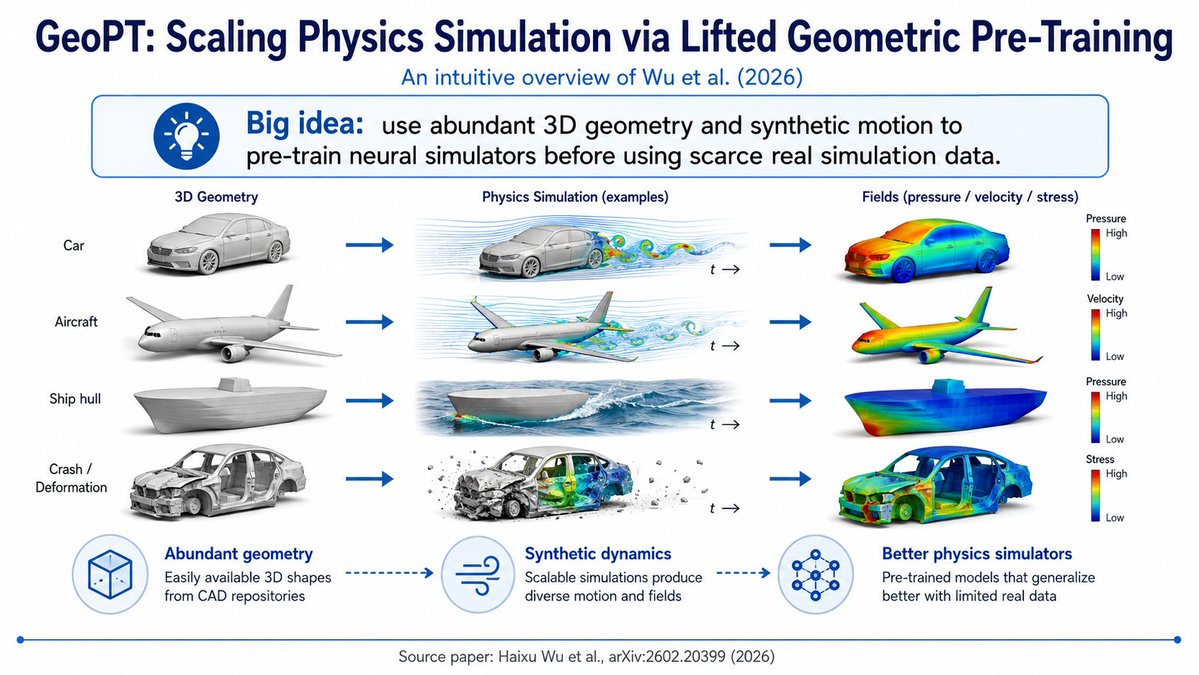
Big idea banner: Under the subtitle, place a rounded rectangle callout with a blue outline and very pale blue fill. On the left is a blue circular lightbulb icon. Text reads: “Big idea:” in bold blue, followed by “use abundant 3D geometry and synthetic motion to pre-train neural simulators before using scarce real simulation data.”

Main layout: A three-column pipeline with exactly 4 rows, connected left-to-right by thick blue arrows. Column headings are: “3D Geometry”, “Physics Simulation (examples)”, and “Fields (pressure / velocity / stress)”. The left side also has 4 row labels: 1) Car, 2) Aircraft, 3) Ship hull, 4) Crash / Deformation.

Row details: Row 1 shows a gray 3D car model, then a car in airflow simulation with blue streamlines and colorful vortices plus a small “t →” time marker, then a car colored with a rainbow heatmap field and a vertical color legend labeled “Pressure” with High at top and Low at bottom. Row 2 shows a gray aircraft model, then an airplane with airflow streamlines and colored wakes plus “t →”, then a rainbow heatmap aircraft with a legend labeled “Velocity” High/Low. Row 3 shows a gray ship hull model, then a ship hull moving through ocean waves with simulated water flow plus “t →”, then a rainbow heatmap ship hull with a legend labeled “Pressure” High/Low. Row 4 shows a damaged gray car body for crash/deformation, then a crash simulation with debris, deformation, and internal colored stress/field visualization plus “t →”, then a rainbow heatmap deformed car body with a legend labeled “Stress” High/Low.

Bottom explanation strip: Include exactly 3 circular icon-and-caption blocks connected by dotted blue arrows. Block 1 icon is a wireframe cube and title “Abundant geometry”, caption “Easily available 3D shapes from CAD repositories”. Block 2 icon is wind/flow lines and title “Synthetic dynamics”, caption “Scalable simulations produce diverse motion and fields”. Block 3 icon is a neural network graph and title “Better physics simulators”, caption “Pre-trained models that generalize better with limited real data”.

Footer: Centered small gray citation text: {argument name="source citation" default="Source paper: Haixu Wu et al., arXiv:2602.20399 (2026)"}.

Visual style: Crisp vector-slide composition mixed with realistic 3D renders, blue academic palette, white background, precise alignment, no clutter, no watermark, no extra rows or icons beyond the specified counts.
Use this prompt in the VdoBloom image editor.
Opens the image editor with this prompt — add your own photo to generate.