Rayleigh Scattering Infographic
Full prompt
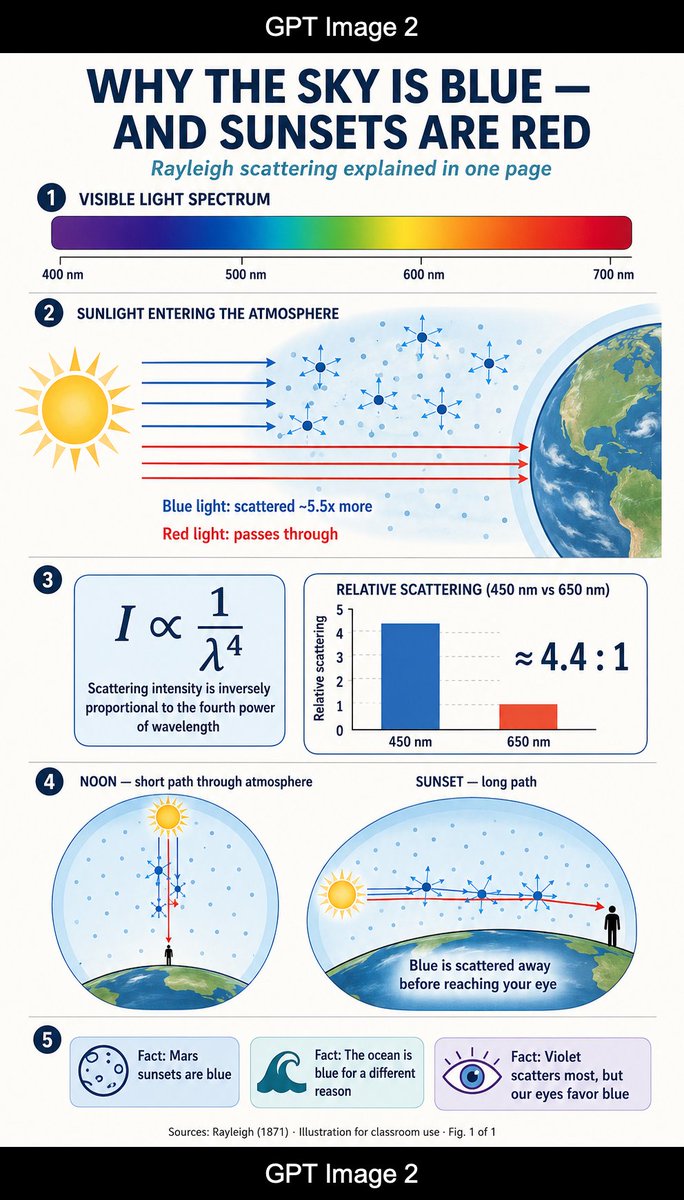
Goal: Create a tall single-page educational science infographic explaining {argument name="headline text" default="WHY THE SKY IS BLUE — AND SUNSETS ARE RED"} with the subtitle {argument name="subtitle text" default="Rayleigh scattering explained in one page"}. Use a clean flat-design science-magazine look, suitable for a classroom handout.

Canvas: Vertical 9:16 poster on an off-white background, framed by black horizontal bars at the very top and bottom. Center the white text “GPT Image 2” inside each black bar. Main infographic area has generous margins, thin navy divider lines, rounded cards, and a navy/teal/coral/yellow palette.

Layout: Use exactly 5 numbered sections, each marked by a dark navy circular badge with white numbers 1 through 5 on the left. Keep all typography geometric sans-serif, with bold uppercase navy headings and teal italic subtitle.

Section 1 — Visible Light Spectrum: Heading reads “VISIBLE LIGHT SPECTRUM”. Show one long rounded horizontal rainbow gradient bar from violet/blue at left through cyan, green, yellow, orange, and red at right. Add exactly 4 wavelength labels beneath it: “400 nm”, “500 nm”, “600 nm”, and “700 nm”, with small tick marks.

Section 2 — Sunlight Entering the Atmosphere: Heading reads “SUNLIGHT ENTERING THE ATMOSPHERE”. Draw a large stylized yellow sun on the left, Earth’s curved edge on the right, and a pale blue atmospheric band between them filled with many small blue air-molecule dots. Show exactly 4 blue horizontal light rays entering and scattering with small blue arrows, plus exactly 3 red horizontal rays passing straight through toward Earth. Include exactly 6 larger molecule/star scattering icons in the atmosphere. Add two explanatory captions below the rays: “Blue light: scattered ~5.5x more” in blue and “Red light: passes through” in red.

Section 3 — Formula and Bar Chart: Create two rounded rectangular cards side by side. Left card shows the large equation “I ∝ 1/λ⁴” and the caption “Scattering intensity is inversely proportional to the fourth power of wavelength”. Right card title reads “RELATIVE SCATTERING (450 nm vs 650 nm)”. Include a simple bar chart with exactly 2 bars: a tall blue bar labeled “450 nm” and a shorter red-orange bar labeled “650 nm”, y-axis labeled “Relative scattering”, and large text “≈ 4.4 : 1” on the right.

Section 4 — Noon vs Sunset: Make two large circular/oval diagrams side by side. Left diagram title: “NOON — short path through atmosphere”. It shows a small sun above a curved Earth horizon, a tiny black human silhouette at ground level, blue dots in the sky, and vertical red and blue rays passing through a short atmospheric path with blue scattering arrows. Right diagram title: “SUNSET — long path”. It shows a low sun near the horizon on the left, a long horizontal path through a pale blue atmosphere over curved Earth, blue light scattering away along the path, a red ray continuing to a black human silhouette at the right, and the caption “Blue is scattered away before reaching your eye”.

Section 5 — Facts: Create exactly 3 rounded fact cards in a row. Card 1 has a simple outlined Mars-like planet icon and text “Fact: Mars sunsets are blue”. Card 2 has a teal ocean wave icon and text “Fact: The ocean is blue for a different reason”. Card 3 has a purple eye icon with rays and text “Fact: Violet scatters most, but our eyes favor blue”.

Footer: Add small centered source text: “Sources: Rayleigh (1871) · Illustration for classroom use · Fig. 1 of 1”.

Visual style: Flat vector illustration, thin navy outlines, soft gradients only where needed, crisp readable labels, science textbook clarity, no photorealism except the Earth texture may be lightly detailed. Keep spacing balanced and ensure every label is legible.
Use this prompt in the VdoBloom image editor.
Opens the image editor with this prompt — add your own photo to generate.