Urban Metabolism Atlas Webpage Screenshot
Full prompt
Goal: Create a clean browser-page screenshot showing a Chinese case-study section that presents a large bilingual infographic poster about an urban systems map.

Canvas: Landscape screenshot, about 917×833 px, white webpage background, cropped so the very top shows the tail end of a Chinese paragraph and the bottom cuts off part of the poster. Use crisp UI-like rendering, not a full browser chrome.

Webpage layout: At the top-left of the visible section, show a small framed picture emoji/icon followed by the bold Chinese heading “精选案例”, with a thin gray horizontal divider line underneath spanning most of the width. Below it, show a bold subsection title: “案例一:信息图可视化”. Under that title place one large infographic image centered with narrow margins.

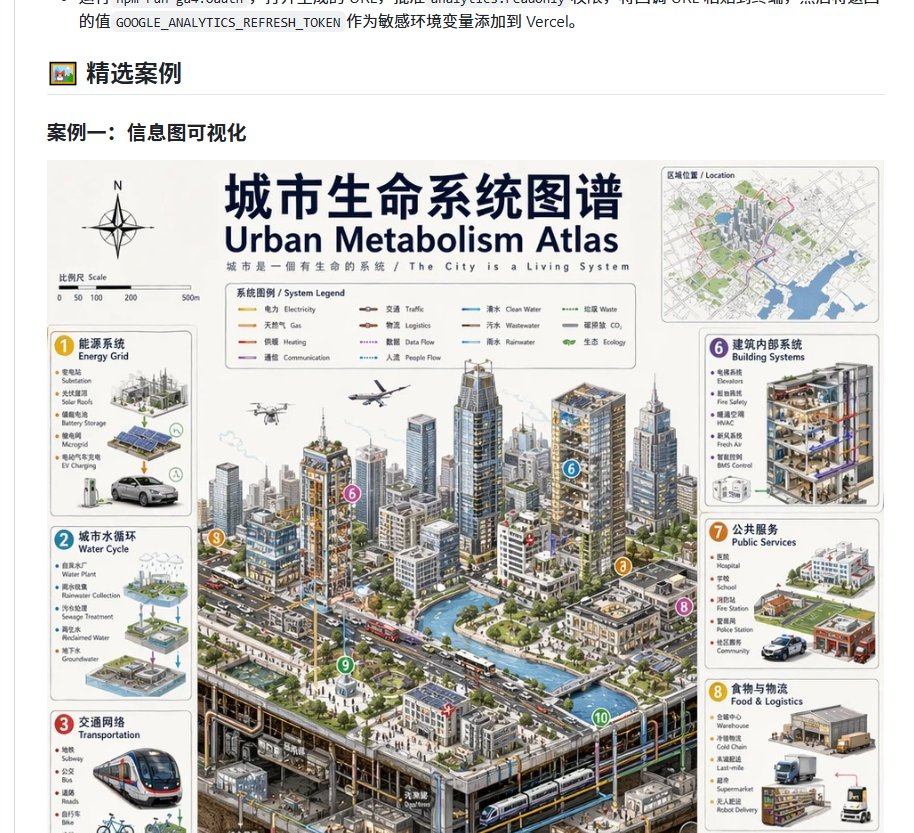
Main poster: Design an information-dense bilingual atlas poster titled “{argument name="main title" default="城市生命系统图谱"}” with the English subtitle “{argument name="English subtitle" default="Urban Metabolism Atlas"}”. Under the title add the small bilingual tagline “城市是一個有生命的系統 / The City is a Living System”. The poster should look like a professional architectural/urban-planning infographic: off-white background, navy headline text, thin gray panel borders, small bilingual labels, diagrammatic icons, and an isometric cutaway city illustration occupying the central majority.

Poster top elements: On the upper left, include a compass rose marked N and a scale bar labeled “Scale” with tick marks 0, 50, 100, 200, 500m. Near the top center, include a boxed “System Legend” with exactly 10 colored line samples labeled: Electricity, Gas, Heating, Communication, Traffic, Logistics, Data Flow, People Flow, Clean Water, Wastewater. On the upper right, include one small inset map card labeled “Location”, showing a simplified city map with green parks, blue waterways, gray streets, and a red boundary.

Central city illustration: Show a dense isometric smart city with many high-rise towers, mid-rise blocks, roads with cars and buses, a blue canal or river, bridges, street trees, plazas, underground metro tunnels and utility pipes visible in a cutaway at the bottom. Include small details such as a drone, airplane, rooftop solar panels, transit stations, pedestrians, and service vehicles. Use thin colored network lines running through the city to imply water, energy, data, logistics, and transit flows. Add exactly 5 visible circular numbered callout markers in the central scene: 6 on a building, 3 near a road/transport corridor, 8 near the right street edge, 9 in a green plaza, and 10 near an underground tunnel/canal edge.

Side information cards: Place exactly 6 visible rounded rectangular system cards around the city, each with a colored numbered badge, bilingual title, small bullet labels, and mini diagrams. Left column has 3 cards: 1 “能源系统 / Energy Grid” with solar panels, battery storage, EV charging, and a car; 2 “城市水循环 / Water Cycle” with water plant, rainwater collection, sewage treatment, reclaimed water, and groundwater diagrams; 3 “交通网络 / Transportation” with a subway train, bus, roads, bicycle icon, and route lines. Right column has 3 cards: 6 “建筑内部系统 / Building Systems” with a cutaway building showing floors, HVAC, fire safety, BMS control, and pipes; 7 “公共服务 / Public Services” with hospital, school, fire station, police station, and community service icons; 8 “食物与物流 / Food & Logistics” with warehouse, cold chain, last-mile delivery, truck, boxes, and robot delivery. Keep the lower portions of the left and right columns slightly cropped by the screenshot edge, matching a captured page view.

Visual style: Highly detailed semi-realistic isometric illustration mixed with technical infographic design, muted grays and whites with navy typography, accent colors yellow, cyan, red, purple, orange, and green. Text should be mostly legible at headline level but many small labels can be tiny. Maintain the feeling of an authentic Chinese web article showcasing an example image.

Constraints: Do not add browser address bars, watermarks, floating toolbars, or extra social-media UI. Preserve the Chinese headings on the webpage and the bilingual poster title hierarchy. The image should look like a screenshot of a generated infographic embedded in a documentation page.
Use this prompt in the VdoBloom image editor.
Opens the image editor with this prompt — add your own photo to generate.